Joe Duarte’s Smart Money Trading Strategy Weekly
By Joe Duarte Editor Joe Duarte in the Money Options
Is this a Total Eclipse for the Bulls? Is the Bottom Near Already?
April 14, 2024
The stock market selloff seems to be picking up steam. Yet, market sentiment is souring so rapidly, that the bottom may be closer than anyone expects.
If you didn’t catch the solar eclipse last week, you missed out on something special. And while it was a stunning sight, I couldn’t help but notice the eerie calm and the strange and out of place dusky light that developed when the moon blocked out the sun. Birds stopped singing, stars suddenly became visible in the sky at midday, and it seemed as if gravity was doing something unusual to my senses and my insides.
It didn’t last long, but I don’t think I will ever forget the moment. Maybe there was more to it than that and it was all that gravitational stuff that unhinged the bond market as yields cracked above crucial resistance levels and prompted stocks to hit the skids as the hotter than expected CPI reignited fears of inflation and raised the odds of no interest rate cuts in the foreseeable future.
Will it All Blow Over Soon? Sentiment is Souring Fast.
Last week I noted that the stock market was the key to the economy. This, of course, is a result of the wealth effect created by rising stock prices allowing strapped consumers to keep on keeping on, even as higher interest rates and inflation continue to squeeze people’s spending ability.
Specifically, I wrote: “if you’re looking for a why we’re not in a recession, look to the stock market, which continues to rumble higher; albeit in fits and starts. Of course, given the global geopolitical situation and the levels of government debt that are accruing, the doom and gloom crowd may eventually be proven to be correct.”
So, is this the start of a meaningful market correction? Maybe. And if it is, will the negative effects of a falling stock market squeeze consumer spending? Possibly.
Interestingly, as I detail below, the CBOE Put/Call ratio (CPC) and the CBOE Volatility Index (VIX) are diverging as the CNN Greed Fear Index is down to 46. It was at 62 last week and at 73 a month ago. All of which may be signaling a quick resolution to the selling.
Still, I’m afraid that a meaningful pullback in stocks over the next few weeks to months, may indeed push the U.S. economy into contraction as the wealth effect shrinks and the M.E.L.A System resets. What’s more important, is whether a slowing economy will eventually reverse the current inflationary trends.
We’ll certainly see. Public opinion remains sanguine. My recent poll on the economy showed that 62% of responders were not worried. In addition, a more recent poll concluded that stocks are over reacting to the latest CPI numbers.
This is a tough market, but it will eventually bottom out. And when it does, the rally will start with a short squeeze. In this video, I show you how to spot the price chart set up and how to trade it.
The Long Term Skinny on Bond Yields
Way back in October 2023, I wrote about how the U.S. Ten Year Note Yield (TNX) was likely to deliver a bullish reversal after trading well above its normal statistical trading distribution. This refers to the relationship between yields and the Bollinger Bands which measure the statistical distribution of prices.
Under normal circumstances, yields rise and fall within two standard deviations, illustrated by the Bollinger Bands, above or below a moving average. Most often the 20-day moving average is the benchmark for intermediate term trading. For very long term trends, I use the 200-day moving average with the upper and lower Bollinger Bands coursing two standard deviations above or below the average. When yields rise above the upper band or fall below the lower band, it’s a signal that the trend is well beyond normal behavior and that a significant reversal from an extraordinarily abnormal situation is likely.
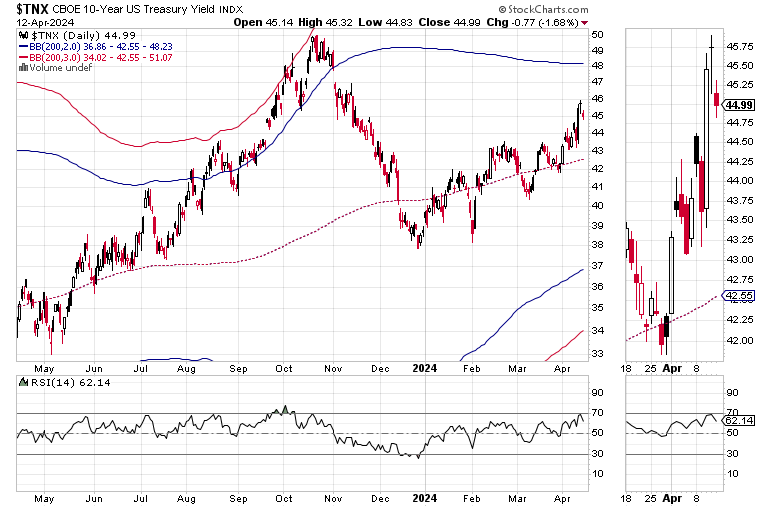
The TNX chart illustrates what happened back to October 2023. The upper blue line is the upper Bollinger Band (2 standard deviations above the 200-day moving average – 2SD). The red line above the 2SD line marks three standard deviations (3SD) above the 200-day moving average, an even more extraordinary and abnormal situation.
The 2SD line is a two-sigma zone, while the 3SD line is a three-sigma zone. The higher the sigma the more abnormal the occurrence. In other words, bond yields were so out of whack in October 2023 that a reversal was not just likely but nearly certain, which is exactly what happened.
Flashing forward to the present, we see that TNX is currently well above its 200-day moving average, yet is still trading well within what is considered “normal” long term statistical parameters – inside the 2SD Bollinger Bands. Moreover, since the upper 2SD line is at 4.8%, given the current situation, it is plausible to consider that a tag of that yield area is now within the realm of possibility, unless something happens that can reverse the perception that inflation is red hot and that it will soon cool off.
If there is a bullish bent on this, it’s the fact that the RSI just brushed the 70 area and that TNX is overbought. The next important level to watch on TNX is 4.7%. A move above that is almost certain to lead to a test of that upper 2SD line. A pullback to the 200-day moving average would be a reprieve for the markets.
Persistently high bond yields are worrisome for stocks. And since the stock market is essentially the backbone of the economy, things may be about to get interesting.
This is one of those times when stock selectivity and prudent account management will pay off handsomely. More than ever, keep these simple trading principles in mind.
- Expect an Increase in Volatility.
- Stick with what’s working; if a position is holding up – keep it;
- Take profits in overextended sectors;
- Consider some short term hedges;
- Look for value in out of favor areas of the market;
- Protect your gains with sell stops. Raise them as prices of your holdings rise;
- Trade one day at a time; and
No matter what, I have a solution for inflation and your wallet. Grab a paycheck via actively trading stocks, via my active trader focused Substack page here. New trades are posted on Mondays.
Big Oil Surges. Is Natural Gas Bottoming?
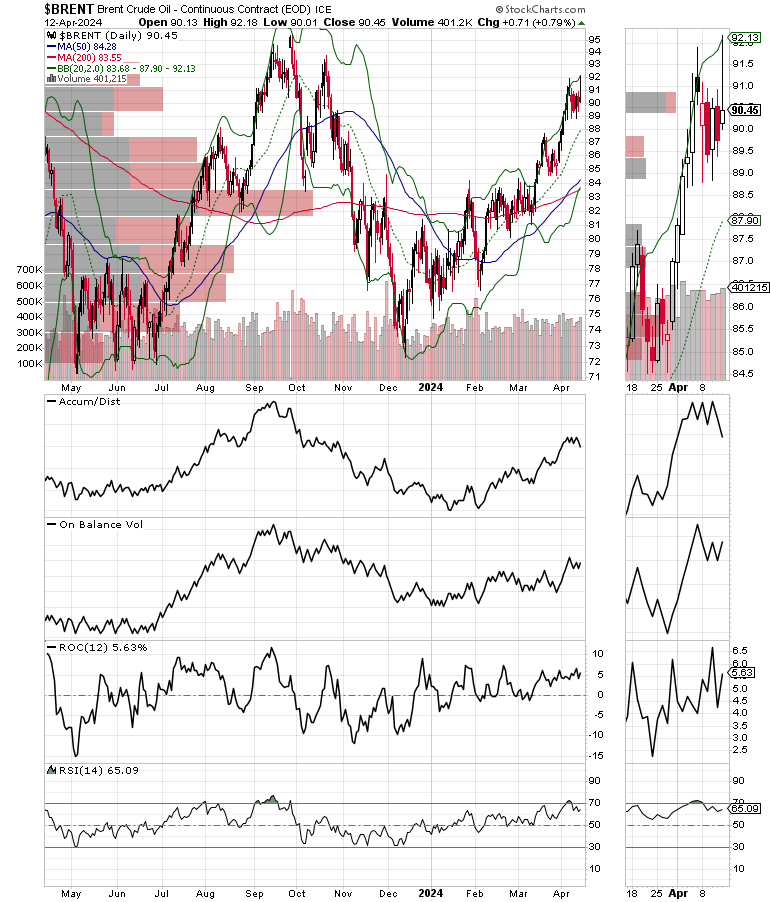
Brent Crude Oil breached and closed above the $90 per barrel price level last week. ADI and OBV are diverging. ADI suggests short sellers are trying to drive the price down while OBV suggests that buyers are hanging on to positions. That sets up the potential for a short squeeze.
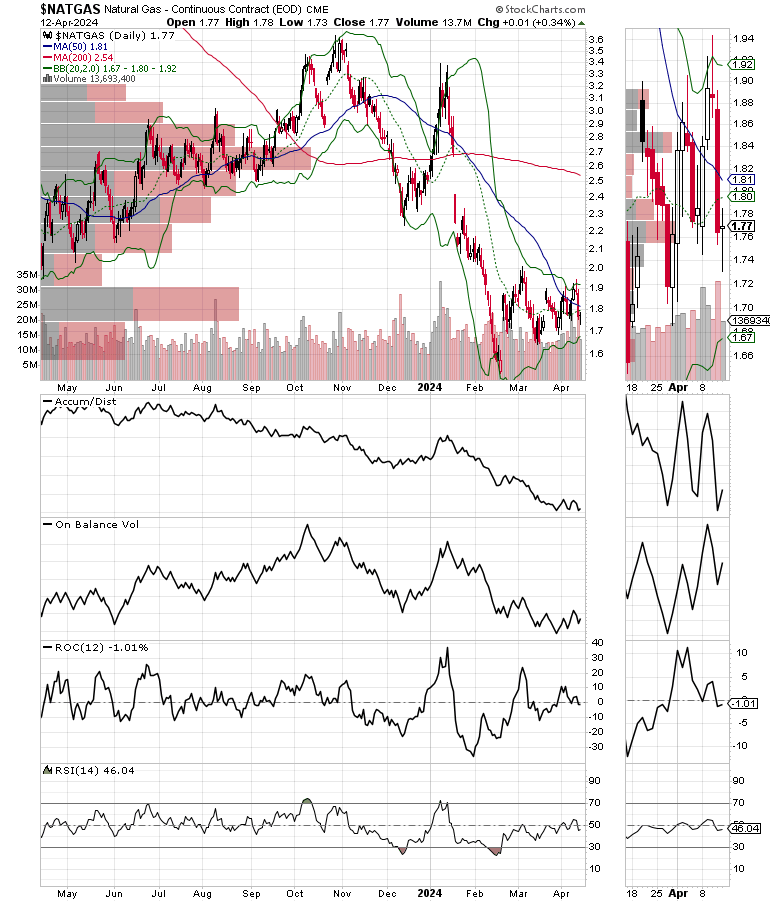
Meanwhile, the news that natural gas prices in the Permian Basin were quoted below zero last week, is worth noting. Similar to what as we saw above with bonds, the price for NATGAS recently traded below the lower 2SD Bollinger band for the 200-day moving average. That suggests that prices will steadily move higher. So, I just added a new natural gas trade which you can access with a Free Two Week Trial here.
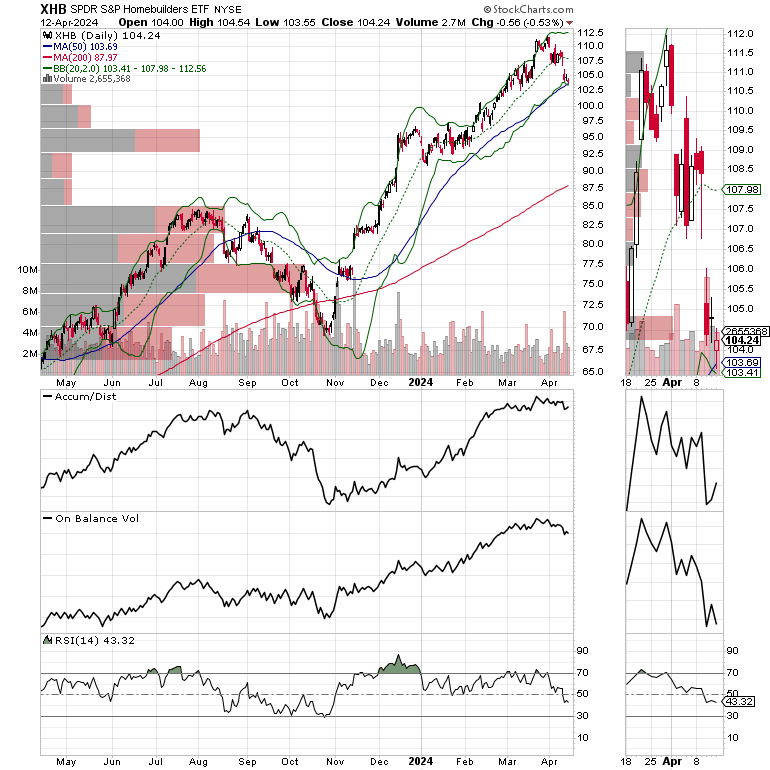
The S&P SPDR Homebuilders ETF (XHB) is testing the bottom of its recent consolidation range after. XHB’s uptrend has been partially fueled by the climate of market timing in the housing sector in which buyers and sellers wait for dips in mortgage and then flood the market during favorable periods. On the other hand, its tight relationship to bond yields remains intact as anytime bond yields fall, XHB stops falling.

ETFs make sense in this market as they let you trade sectors which can withstand inflation and volatility. My new service, Joe Duarte’s Sector Selector is all about ETFs and tactical trading. It’s FREE with your monthly membership. Sign up here.
NYAD in Short Term Downtrend. No Panic in NDX or SPX.
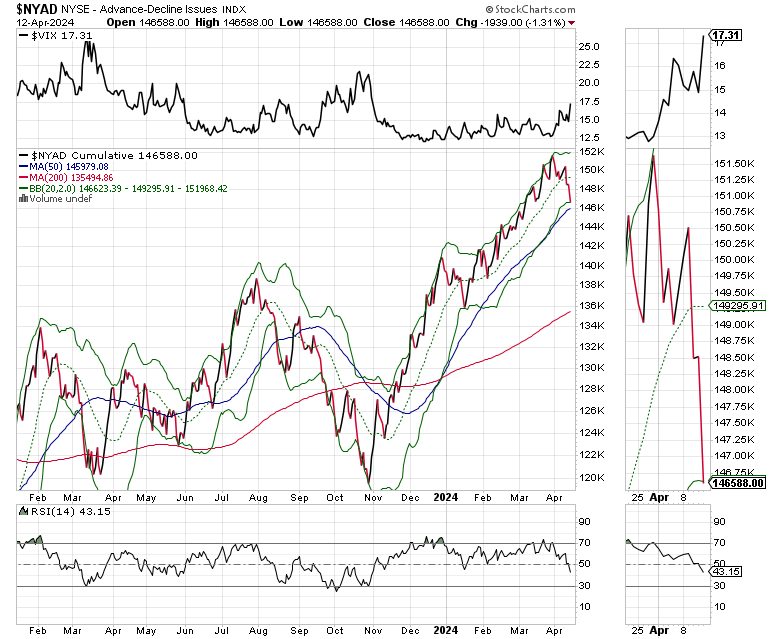
The NYSE Advance Decline line (NYAD) reversed its recent uptrend, breaking below its 20-day moving average and heading for a test of its 50-day line.
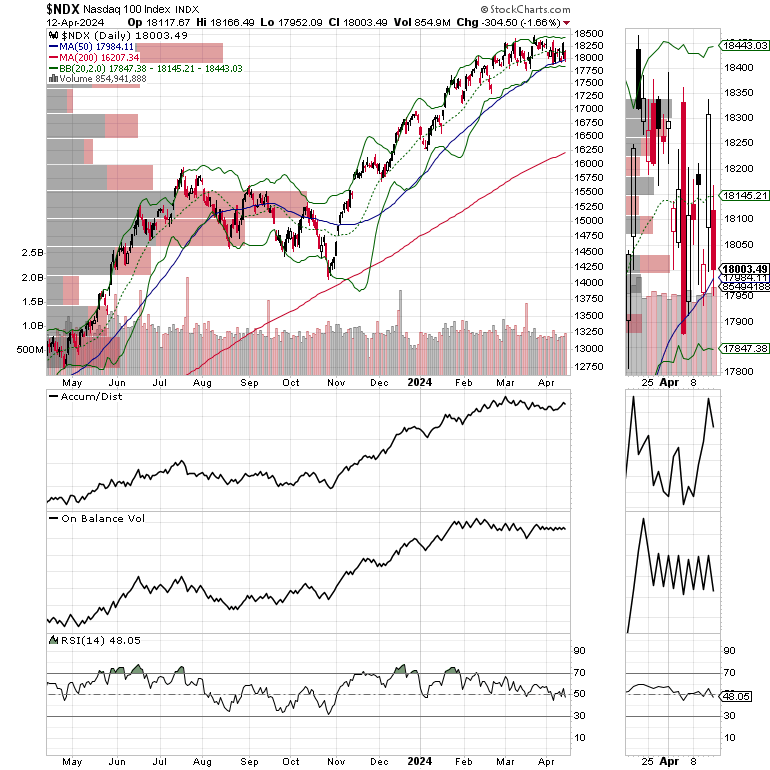
The Nasdaq 100 Index (NDX) held above 18,000. The ADI and OBV lines remained remarkably stable The 50-day moving average is still reliable support.
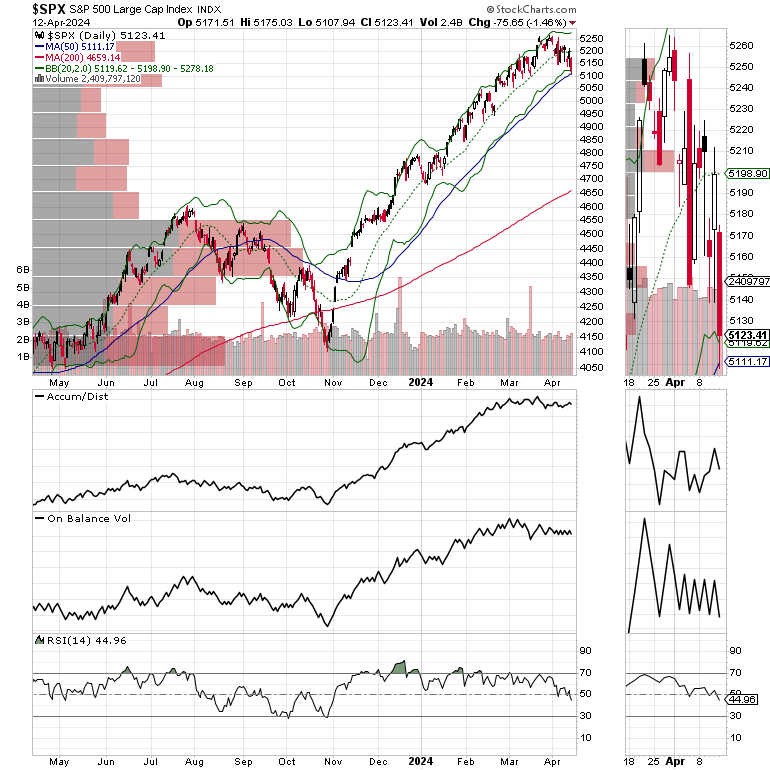
The S&P 500 (SPX) is also testing the support of its 50-day moving average, and may test the 5000 area. ADI is OBV are holding steady.
Mixed Signals. VIX Breaks Out to the Up Side. P/C ratio crashes.
The CBOE Volatility Index (VIX), moved above 17, a bearish sign. If VIX continues to climb expect more volatility in stocks. A sustained move in VIX above 15 will turn things increasingly bearish.
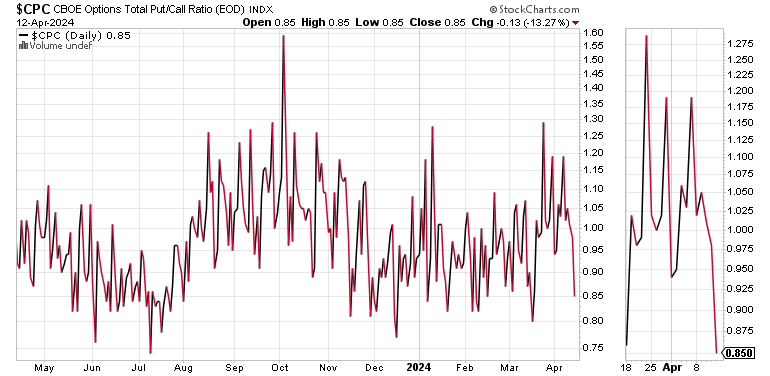
On the other hand, the Put/Call ratio fell below 1. This divergence suggests that there is a lot of hedging in the market. When the put/call ratio and VIX rise together, it usually means that volatility is on the rise.
VIX rises when traders buy large volumes of put options. Rising put option volume leads market makers to sell stock index futures to hedge their risk and leads markets lower. A fall in VIX is bullish signaling lower put option volume, eventually leads to call buying which is bullish as it causes market makers to buy stock index futures raising the odds of higher stock prices.
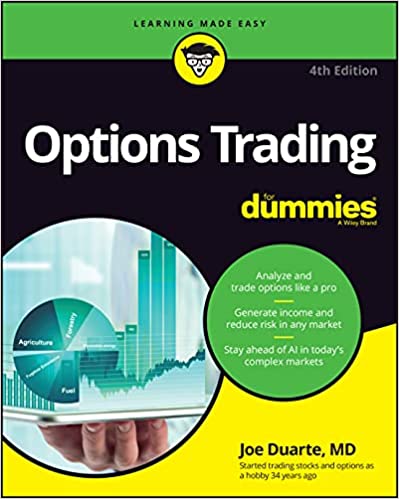
To get the latest up to date information on options trading, check out “Options Trading for Dummies”, now in its 4th Edition – Available Now!
#1 New Release in Options Trading
Now in Audible Audiobook Format
Options Trading for Dummies (4th Edition)  Audible Audiobook – Unabridged Audible Audiobook – Unabridged
Joe Duarte MD (Author), Terrence Kidd (Narrator), Tantor Audio (Publisher)
4.5 out of 5 stars 61 ratings
#1 New Release in Investment Analysis & Strategy
# 1 New Release on Options Trading
Good news! I’ve made my NYAD-Complexity - Chaos charts featured on my YD5 videos, and a few more available here.
Joe Duarte is a former money manager, an active trader and a widely
recognized independent stock market analyst since 1987. He is author
of eight investment books, including the best selling Trading
Options for Dummies, rated a TOP
Options Book for 2018 by Benzinga.com - now in its third edition, The
Everything Investing in your 20s and 30s and six other trading books.
Meanwhile, the U.S. Ten Year note yield (TNX) is trading in a The
Everything Investing in your 20s & 30s at Amazon and The
Everything Investing in your 20s & 30s at Barnes and Noble.
A
Washington Post Color of Money Book of the Month is now available.
To receive Joe’s exclusive stock, option, and ETF recommendations, in
your mailbox every week visit https://joeduarteinthemoneyoptions.com/secure/order_email.asp.
JoeDuarteInTheMoneyOptions.com is independently
operated and solely funded by subscriber fees. This web site and
the content provided is meant for educational purposes only and
is not a solicitation to buy or sell any securities or investments.
All sources of information are believed to be accurate, or as otherwise
stated. Dr. Duarte and the publishers, partners, and staff of joeduarteinthemoneyoptions.com
have no financial interest in any of the sources used. For independent
investment advice consult your financial advisor. The analysis
and conclusions reached on JoeDuarteInTheMoneyOptions.com are the
sole property of Dr. Joe Duarte.
| 


