Joe Duarte’s Smart Money Trading Strategy Weekly
By Joe Duarte Editor Joe Duarte in the Money Options
Everyone Suddenly Hates U.S. T-Bonds. What that Means and Why it’s Important to Stocks and Everything Else.
October 15, 2023
No One Seems to Want U.S. Treasury Bonds. Does This Sound Familiar?
The slightly hotter than predicted PPI and CPI numbers certainly put a temporary damper on the recent short covering rally in stocks and bonds, raising investor fears about further interest rate increases. But, as I’ve noted recently, fear is often the prelude to a buying opportunity.
Such an opportunity may be developing in the U.S. Treasury bond market and related interest sensitive sectors of the stock market such as homebuilders, real estate investment trusts, and select technology stocks.
Still, the financial markets are reaching a decision point as:
- The market’s breadth faces a test of support;
- Oil prices rebound;
- Bond yields trade at extraordinary levels; and
- Geopolitical storms arise and escalate in multiple regions simultaneously.
There Are No Bond Bulls Left.
Suddenly, no one wants to own U.S. Treasury bonds. This bearish climate resembles the negative market sentiment we saw in crude oil back in May 2022 right before prices bottomed and rallied well into the early fall.
The headlines blame inflation for the rise in rates. But that’s only part of the story, as the recent climb in yields, such as what we’ve seen in the U.S. Ten Year Treasury Note (TNX) over the past few weeks is also due to what may be coordinated selling by China, Brazil, and Saudi Arabia, according to a report on the crypto site The Daily HODL, which noted the BRICS trio, combined, sold over $17 billion in U.S. Treasuries in the month of September alone.
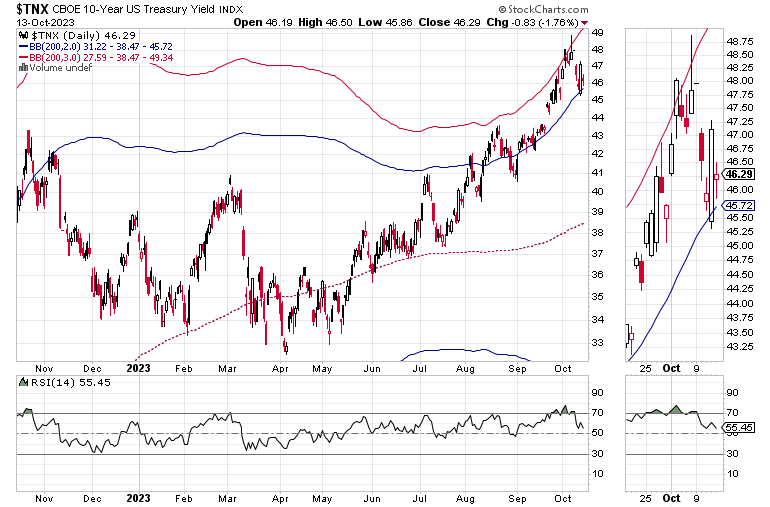
From an investment standpoint what’s important is that this highly unusual trading pattern often precedes a trend reversal which seems to be unfolding, in fits and starts. Let’s put this in perspective. TNX is now trading between two and three standard deviations above its 200-day moving average; an event which has exceeded normal long term pricing expectations by a two to threefold margin.
The key to this price chart is the area between the upper red and blue lines. Those are not moving averages. They are Bollinger Bands. The red line is three standard deviations above the 200-day moving average while the blue line marks two standard deviations above the 200-day moving average.
In other words, TNX is trading so far above what is considered “normal” that it’s in uncharted territory as defined by its standard deviations from the norm.
This is unsustainable, which means that when the reversion to the mean occurs it should be quite sizeable. If there is no reversion to the mean, then the bond market is being redefined. I don’t know what that means, but it doesn’t sound like it would end well given its central role in global finance.
The key is what happens at the 4.5% yield and the RSI 50 level. If yields fall below those two important benchmarks, it would signal that the bond market is getting back to a more normal trading pattern.
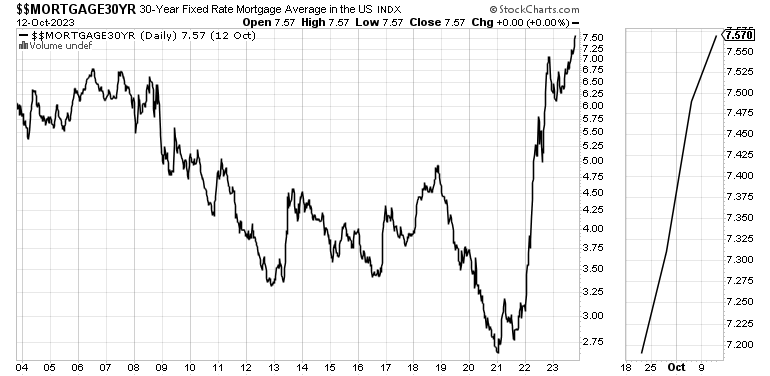
This rise in TNX has triggered an equally unsustainable rise in mortgage rates, which would be expected to lead to a crash in homebuilder stocks.
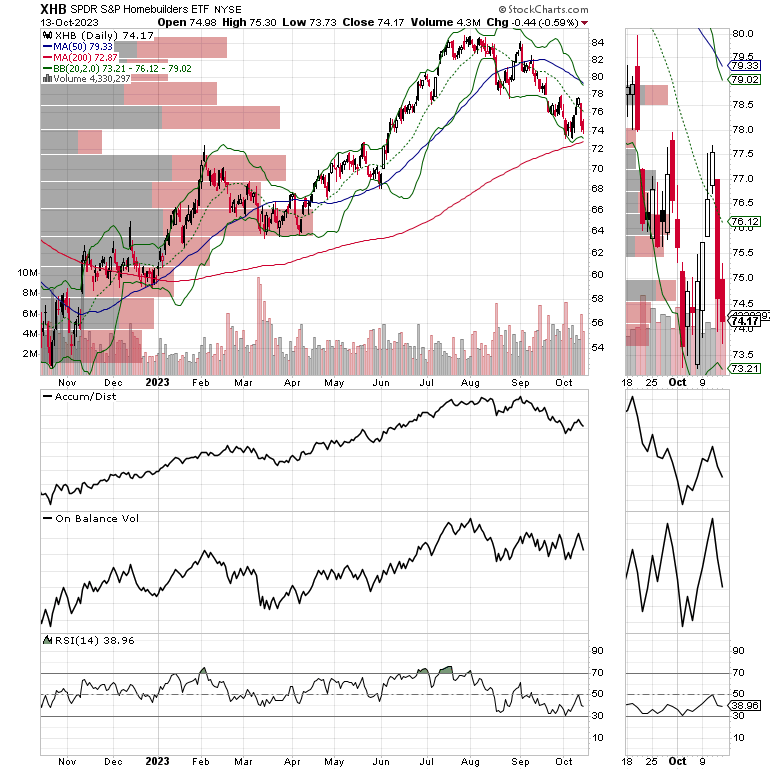
Yet, the SPDR S&P Homebuilders ETF (XHB), although in a price correction has yet to make a new low in response to the most recent spike in yields and mortgage rates. This is a bullish development for patient investors in homebuilder stocks. As long as XHB holds above the 200-day moving average, the homebuilder trade remains constructive.
Join the smart money at Joe Duarte in the Money Options.com where I have just added five home builder stocks to the model portfolios. You can have a look at my latest recommendations FREE with a two week trial subscription.

And for frequent updates on real estate and housing, click here.
Picking Up the Pieces in the Oil Patch
The oil sector has quickly recovered after being sold aggressively in response to a 10/4/23 U.S. EIA report which showed a larger than expected build in gasoline supplies. The market was well overbought ahead of that and was certainly ripe for such an event.
That said, the initially rapid decline in crude has slowed, partially due to the unfolding events in Israel and the potential for oil supply disruptions. All of which begs the question of what’s next for the oil sector.
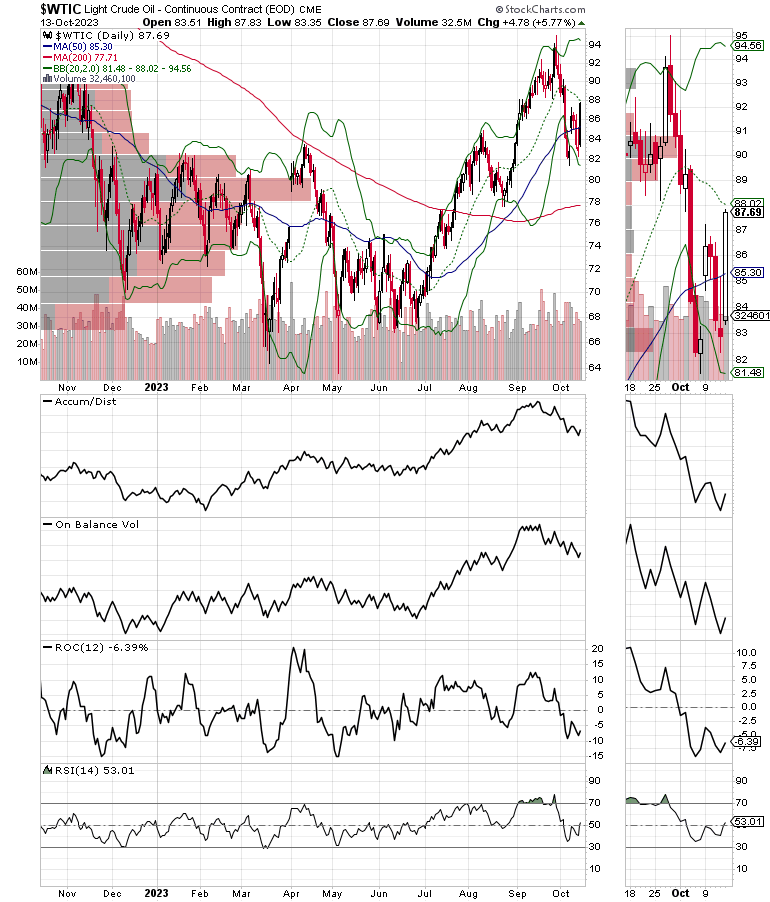
West Texas Intermediate (WTIC) has found support at the $85 area near its 50-day moving average and now looks to get back above $90. If successful, look for another attempt to move above $95.
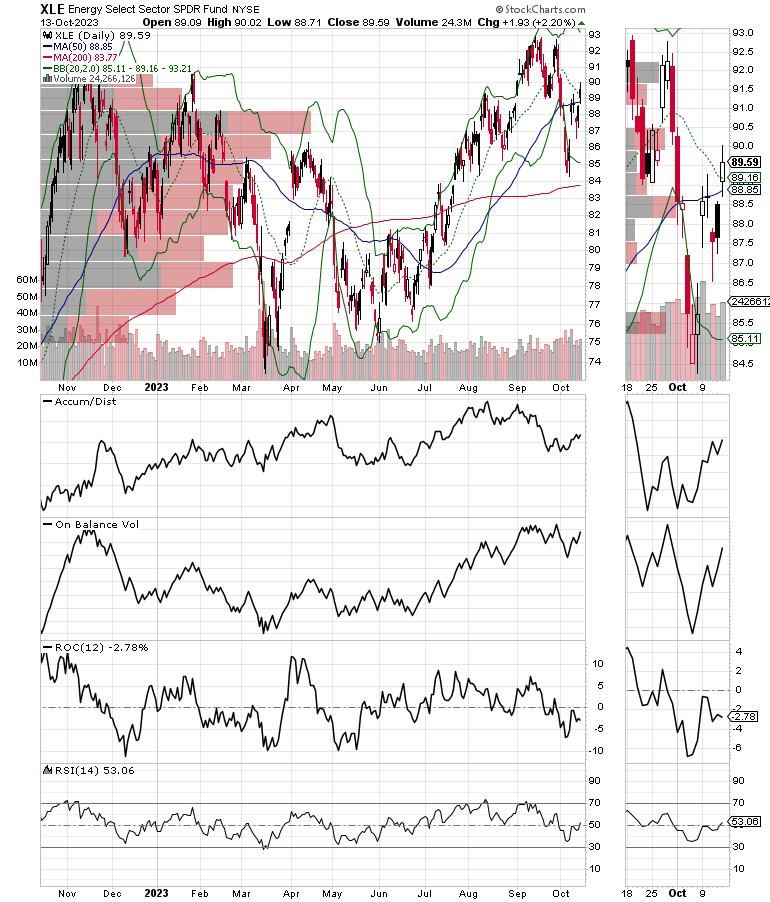
The diversified Energy Sector SPDR ETF (XLE) has recovered, moving back above its 50-day moving average after last week’s sudden selloff, which took it to a nearly oversold RSI reading. It does have a substantial amount of support in the combination of a huge block of Volume by Price (VBP bars) as well as the 200-day moving average as far down as $84. Accumulation/Distribution (ADI) and On Balance Volume (OBV) both turned up to confirm the return of positive money flows into the sector.
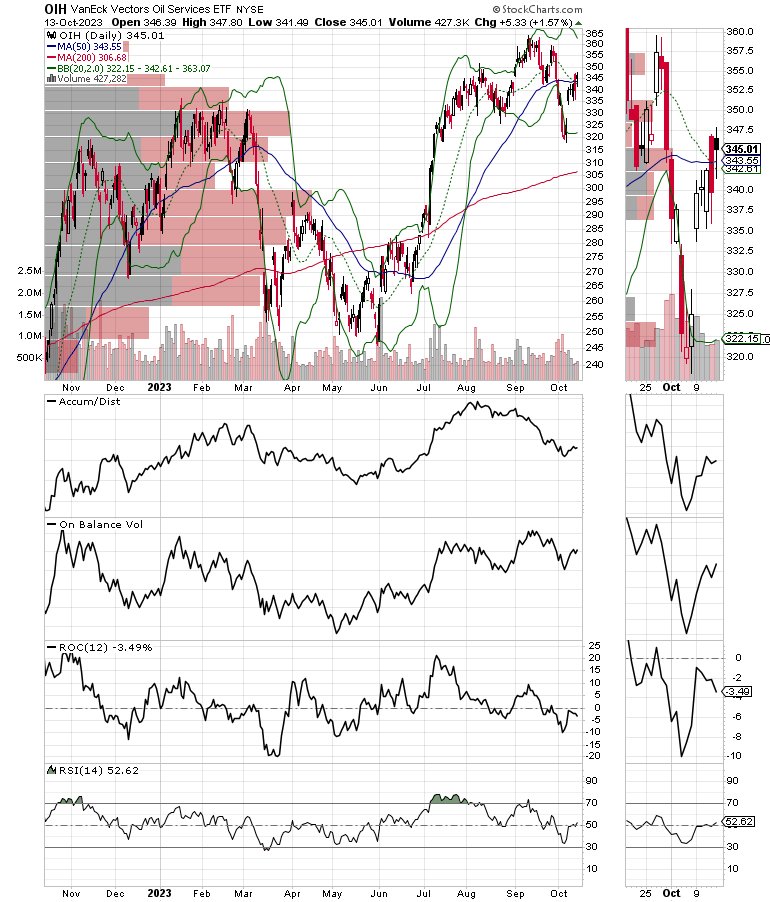
The Van Eck Oil Service Sector ETF (OIH) held up better than XLE on the selloff but has not rebounded to the same degree. It has found support near its 50-day moving average while ADI and OBV are turning up as well.
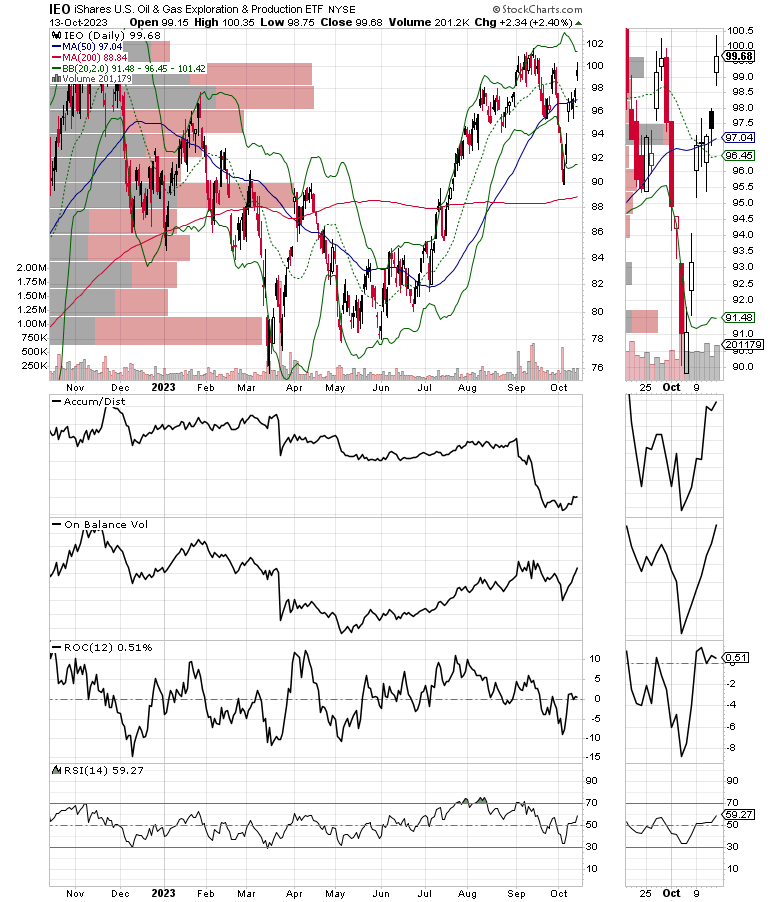
A more bullish pattern is visible in the iShares U.S. Oil & Gas Exploration ETF (IEO), which is nearing its recent highs and is on the verge of a breakout. I recently posted two new energy stock trades at Joe Duarte in the Money Options.com, here.
Incidentally, if you’re looking for the perfect price chart set up, check out my latest YD5 video, where I detail one of my favorite bullish setups. This video will prepare you for the next phase in the market.
The Market’s Breadth Remains Above Support
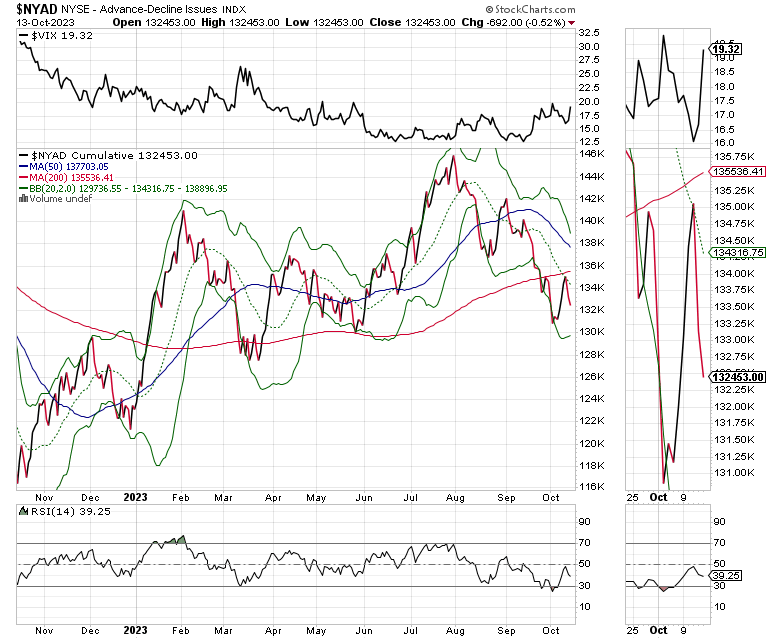
The NYSE Advance Decline line (NYAD) remained below its 200-day moving average last week, but again remained above its recent March and May bottoms. A break below those levels would be very bearish. On the other hand, any further weakness in NYAD would lead to an oversold reading in the RSI, which could be the final washout of this correction.
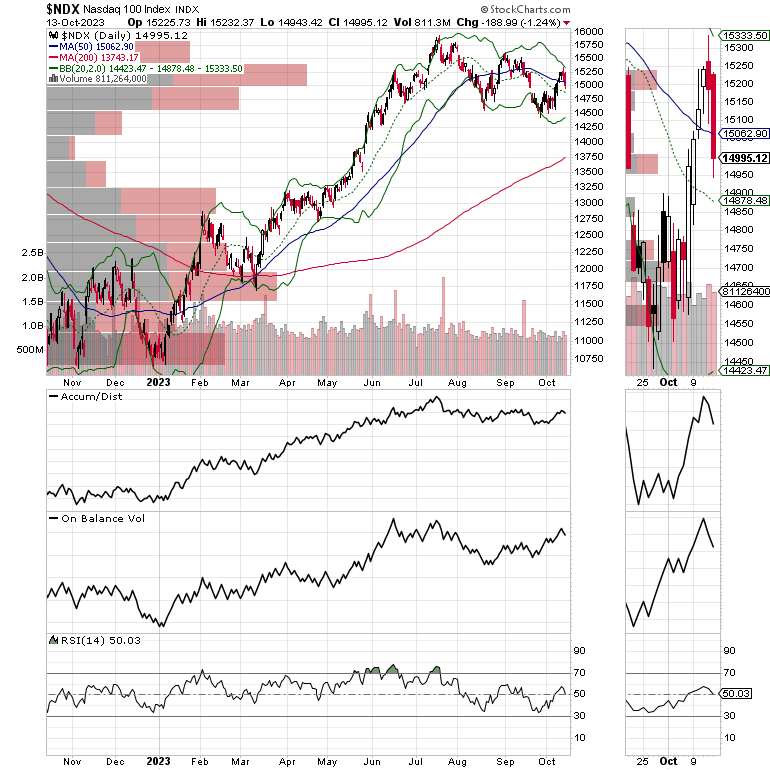
The Nasdaq 100 Index (NDX) continues to test the 14500-15000 trading range area, with support at its 50-day moving average. ADI and OBV are both bouncing which means short covering (ADI) and buying (OBV) are occurring simultaneously
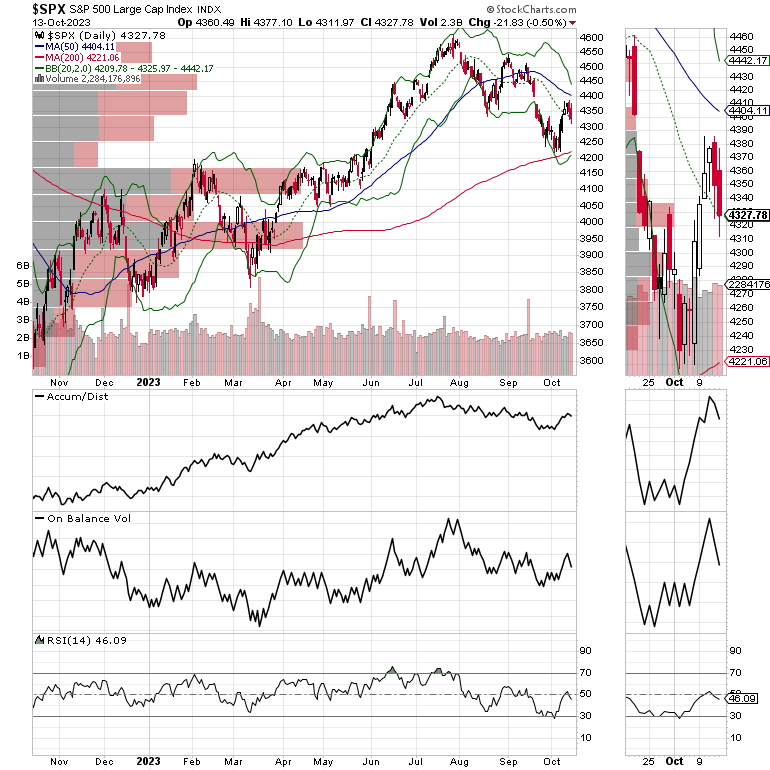
The S&P 500 (SPX) is struggling between the 4250-4400 area with the 50-day moving average providing overhead resistance. ADI is rising as short sellers cover their positions. If OBV turns up, it will be even more bullish.
VIX Remains Below 20
As it has done for the past few weeks during which the market has corrected VIX has remained stubbornly below the 20 area despite multiple attempts to rise above this key chart point. A move above 20 would be very negative.
When VIX rises stocks tend to fall as it signifies that traders are buying puts. Rising put volume is a sign that market makers are selling stock index futures in order to hedge their put sales to the public. A fall in VIX is bullish as it means less put option buying, and it eventually leads to call buying which causes market makers to hedge by buying stock index futures raising the odds of higher stock prices.
To get the latest up to date information on options trading, check out “Options Trading for Dummies”, now in its 4th Edition – Available Now!
#1 New Release in Options Trading
Now in Audible Audiobook Format
Options Trading for Dummies (4th Edition)  Audible Audiobook – Unabridged Audible Audiobook – Unabridged
Joe Duarte MD (Author), Terrence Kidd (Narrator), Tantor Audio (Publisher)
4.5 out of 5 stars 61 ratings
#1 New Release in Investment Analysis & Strategy
# 1 New Release on Options Trading
Good news! I’ve made my NYAD-Complexity - Chaos charts featured on my YD5 videos, and a few more available here.
Joe Duarte is a former money manager, an active trader and a widely
recognized independent stock market analyst since 1987. He is author
of eight investment books, including the best selling Trading
Options for Dummies, rated a TOP
Options Book for 2018 by Benzinga.com - now in its third edition, The
Everything Investing in your 20s and 30s and six other trading books.
Meanwhile, the U.S. Ten Year note yield (TNX) is trading in a The
Everything Investing in your 20s & 30s at Amazon and The
Everything Investing in your 20s & 30s at Barnes and Noble.
A
Washington Post Color of Money Book of the Month is now available.
To receive Joe’s exclusive stock, option, and ETF recommendations, in
your mailbox every week visit https://joeduarteinthemoneyoptions.com/secure/order_email.asp.
JoeDuarteInTheMoneyOptions.com is independently
operated and solely funded by subscriber fees. This web site and
the content provided is meant for educational purposes only and
is not a solicitation to buy or sell any securities or investments.
All sources of information are believed to be accurate, or as otherwise
stated. Dr. Duarte and the publishers, partners, and staff of joeduarteinthemoneyoptions.com
have no financial interest in any of the sources used. For independent
investment advice consult your financial advisor. The analysis
and conclusions reached on JoeDuarteInTheMoneyOptions.com are the
sole property of Dr. Joe Duarte.
|