Joe Duarte’s Smart Money Trading Strategy Weekly
By Joe Duarte Editor Joe Duarte in the Money Options
Two Moonshots. A Lunar Landing and a Stealth Breakout in the Homebuilders.
February 25, 2024
The stock market delivered a set of new highs last week confirmed by the market’s breadth. This uncanny combination may be signaling a potential, and against all odds, acceleration of the rally in stocks.
Landings, Moonshots, and Breakouts
What a week it was. We got two moonshots, one in the realm of space travel and one in the stock market.
First in the realm of moonshots, the U.S. is back on the moon, albeit with a bit of asterisk – Odysseus landed on its side. Second, Nvidia (NVDA) delivered its own moonshot by crushing its earnings report and again offering a bullish outlook, taking the stock market higher. And in a stealthy but potentially powerful move, the homebuilder sector broke out to a new high, in the same week in which mortgage rates closed in on 7%.
Of course, given the stratospheric readings in market sentiment gauges, such as the CNN Greed-Fear Index, which recently clocked in at 78, you’ve got to wonder what’s going to happen next. As a result, while it’s prudent to stick with what’s working, it’s worth noting that disciplined trading is the best approach. So, keep these simple principles in mind:
- Stick with what’s working; if a position is holding up – keep it;
- Take profits in overextended sectors;
- Consider some short term hedges;
- Look for value in out of favor areas of the market that are showing signs of life; and
- Protect your gains with sell stops and keep raising them as prices of your holdings rise.
The Moonshot and the Lunar Landing
Outside the markets, a small Houston based space company scored at least a field goal by putting an unmanned craft, called Odysseus, on the moon. There are some bugs to figure out for sure – Odysseus landed on its side. But it’s still a decent win for the space program, which over time is likely to mean that new forms of technology will trickle out and offer investment opportunities.
All of which brings me to the inevitable mention of AI, whose effects and influences are still developing in our daily lives, much as the status of Odysseus and what will come of it as its programmers sort out how to make the craft stand up. Closer to home, the big gorilla in AI continues to be Nvidia (NVDA), whose shares scored their own moonshot last week after a colossal earnings beat accompanied by big and boffo guidance.

The price chart speaks for itself. This stock has shot well past the moon and seems headed for Mars and beyond – until technical reality sets in, of course. Certainly, NVDA is on to something and investors recognize it. But the stock has come way too far, at nearly the speed of light. Note that it blew past its upper Bollinger Band on Friday, which means it will likely reverse course, at least in the short term. Moreover, a big chunk of the gains came from short covering, as the Accumulation/Distribution (ADI) indicator rallied while the On Balance Volume line (OBV) barely ticked up.
Also, raw volume suggests that although the price of the stock, and the ensuing media hype were over the top, actual interest in the shares may not have been that enthusiastic. Nevertheless, I’m not expecting more than a normal pullback here in the short term. The 20-day moving average seems like a reasonable target. What’s most important is whether they buy the inevitable dip and how far up they can take the stock if they do.
Let’s hope that NVDA doesn’t pull and Odysseus and fall on its side.
Bond Yields Test Potential Reversal
Back on the ground, there are more earthly matters to consider; such as interest rates, especially what the Federal Reserve is likely to do and how the bond market responds. As I noted last week, the current levels of interest rates are making life difficult to navigate for both consumers and businesses.
This is obvious even to the Fed, which has now been softening its message, hinting they will keep rates at current levels for a while.
This softer tone from the Fed seems to have changed a few bond traders’ perception of the trend in the U.S. Ten Year Note (TNX), which has delivered a short term top just above 4.3%. Of course, what really matters is what happens at 4.15%, where the 20, 50, and 200 day moving averages are clustered and where the algos are poised to buy or sell depending on what happens there.
A move below that key level would likely spur stock prices higher, especially in the homebuilder sector, as I describe below.
Stealth Breakout in Homebuilders
The rolling over of bond yields delivered what may be a meaningful development for the homebuilder sector, unless of course the above described fall in TNX is temporary. I wrote a detailed description of my thoughts on this on Friday; here. The bottom line is that:
- The rise in interest rates has hampered the public’s purchasing power;
- Home prices have pulled back as the Fed raised rates and sales volumes fell;
- The equilibrium between supply and demand remains in favor of the homebuilders;
- Buyers may be starting to panic, which means;
- A new and perhaps frenetic buying frenzy for new homes may be developing.

You can see the market may be starting to price that potential buying wave in as the S&P SPDR Homebuilders ETF (XHB) where a breakout is developing, despite the recent climb in mortgage rates. It’s difficult to explain this event other than by noting that money is moving into the sector. And that means that big investors may know something the rest of us don’t. You can check out my homebuilder picks with a Free Two Week trial to my service, here.

It’s important to remember that mortgage rates lag the U.S. Ten Year Note yield by about a week. That means that if TNX continues to fall, especially below 4.15%, mortgage rates will drop by next week, which would spur activity in the housing market, and in the homebuilder stocks. New home sales data is scheduled for release on 2/27/23/
Inflation is hurting everyone, but there is a solution. If you’re looking for a to generate a paycheck via actively trading stocks, check out my active trader focused Substack page here.

For ideas on how to hedge against risk, my latest video offers details on the successful use of put options in real time. Check it out here.
S&P 500 Expands Rally Above 5000. Market Breadth Close to Confirming.
The NYSE Advance Decline line (NYAD) made a new intraday high on 2/23/24, confirming the return above 5000 by the S&P 500 (SPX). But closed just shy of it. Still, the uptrend gets the benefit of the doubt.

The Nasdaq 100 Index (NDX) remains in an uptrend. The 18,000 level is becoming a point of contention. ADI is rising but OBV is flat, suggesting buyers are being selective in their actions (OBV) while short sellers (ADI) are getting spanked.

The S&P 500 (SPX) reclaimed the 5000 level. 4975 is short term support. ADI and OBV remain in bullish patterns.

VIX Remains Below 15
The CBOE Volatility Index (VIX) remained below 15. This, remains a bullish factor for stocks. If VIX remains subdued more upside is possible. A sustained move above 15 will turn things bearish.
A rising VIX means traders are buying large volumes of put options. Rising put option volume from leads market makers to sell stock index futures to hedge their risk. A fall in VIX is bullish as it means less put option buying, and it eventually leads to call buying which causes market makers to hedge by buying stock index futures raising the odds of higher stock prices.
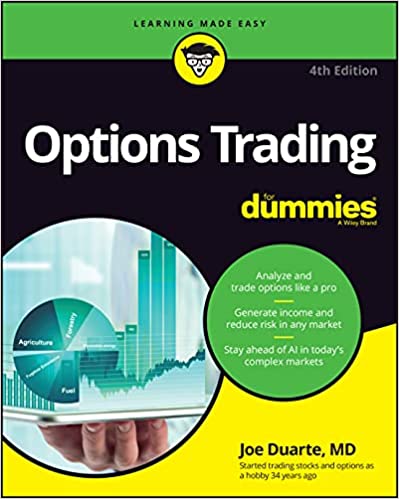
To get the latest up to date information on options trading, check out “Options Trading for Dummies”, now in its 4th Edition – Available Now!
#1 New Release in Options Trading
Now in Audible Audiobook Format
Options Trading for Dummies (4th Edition)  Audible Audiobook – Unabridged Audible Audiobook – Unabridged
Joe Duarte MD (Author), Terrence Kidd (Narrator), Tantor Audio (Publisher)
4.5 out of 5 stars 61 ratings
#1 New Release in Investment Analysis & Strategy
# 1 New Release on Options Trading
Good news! I’ve made my NYAD-Complexity - Chaos charts featured on my YD5 videos, and a few more available here.
Joe Duarte is a former money manager, an active trader and a widely
recognized independent stock market analyst since 1987. He is author
of eight investment books, including the best selling Trading
Options for Dummies, rated a TOP
Options Book for 2018 by Benzinga.com - now in its third edition, The
Everything Investing in your 20s and 30s and six other trading books.
Meanwhile, the U.S. Ten Year note yield (TNX) is trading in a The
Everything Investing in your 20s & 30s at Amazon and The
Everything Investing in your 20s & 30s at Barnes and Noble.
A
Washington Post Color of Money Book of the Month is now available.
To receive Joe’s exclusive stock, option, and ETF recommendations, in
your mailbox every week visit https://joeduarteinthemoneyoptions.com/secure/order_email.asp.
JoeDuarteInTheMoneyOptions.com is independently
operated and solely funded by subscriber fees. This web site and
the content provided is meant for educational purposes only and
is not a solicitation to buy or sell any securities or investments.
All sources of information are believed to be accurate, or as otherwise
stated. Dr. Duarte and the publishers, partners, and staff of joeduarteinthemoneyoptions.com
have no financial interest in any of the sources used. For independent
investment advice consult your financial advisor. The analysis
and conclusions reached on JoeDuarteInTheMoneyOptions.com are the
sole property of Dr. Joe Duarte.
|