This is not a Bear Market
By Joe Duarte on June 19, 2017
If you own any of the previously high flying large cap tech or so-called
FANG stocks, you think you’re in a bear market, and you may be correct.
If you don’t, you have more likely been inconvenienced and rightly
concerned. Moreover after it’s all said and done what really matters
is whether we are still in a bull market or whether we’ve transitioned
into a bear market. And since the selling has mostly occurred in the
large cap technology sector, my only conclusion based on the available
evidence- unless something changes drastically, is we are still in
a bull market for a majority of stocks. That being said, I must tell
you it’s an old bull market as measured in years as well as being long
in the tooth in its latest leg, the post presidential election rally.
I must also add that old bull markets don’t last forever, so it’s not
a time to be unconcerned. But the real question is whether it’s a time
to sell. So, let’s have a look at the evidence.
Pick Your Poison
Generally speaking, in this market, you can make a fairly good case
for being bullish or being bearish. For example, if you’re bearish
you can point to the Federal Reserve’s most recent interest hike as
being the fourth in a series, with more likely to come – if Ms. Yellen
holds her nerve. This would be an important point for the bears since
history shows that three or more interest rate increases in a row often
precede bear markets. Meanwhile, bears can also point to softening
economic data and a general deterioration in both global and domestic
politics as reasons to be concerned, and in a fundamental sense they
have a point.
Be that as it may, if you’re a bull you can counter with the fact
that outside of technology the market’s in pretty good shape, all things
considered. Furthermore history also shows that as long as there is
gridlock in Washington and general discord in the world, stock prices
generally, and perhaps cynically, tend to rise. So what’s an investor
to do? It’s fairly straightforward - at this point, we have little
choice but to give the bulls and the bears some credit and to be vigilant.
Yet, since the ultimate truth in trading is price action, we should
also let the charts guide us.
S & P 500 Holds Support
The Standard & Poor’s 500 Index of Large Cap Stocks (SPX) remains
in a very steady uptrend and is ignoring the aggressive decline in
the high tech sector, at least for now. This is partly due to the improvement
in the financial and housing stocks which have seen money rotating
into their coffers as investors run from the tech selloff.
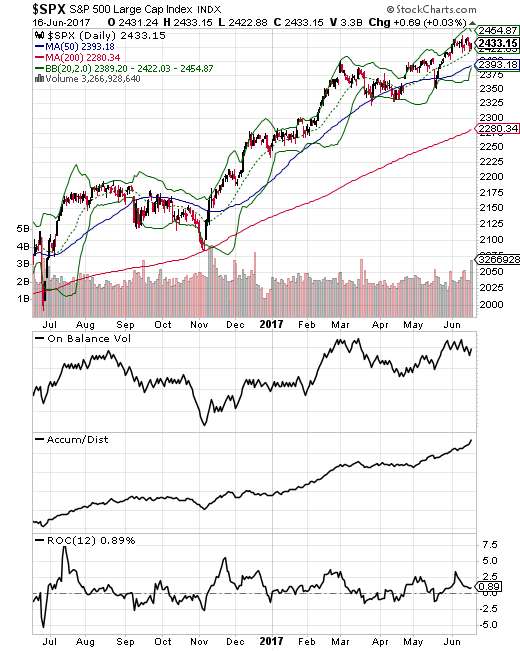
More important from a decision making standpoint, investors should keep
in mind that as long as SPX remains above its 50-day moving average, the uptrend
for the overall market remains intact.
Small and Midcap Sectors Remain Stable
The large cap stocks, except technology, are still holding
up. But more surprising and encouraging is the overall steady performance of
the Russell 2000 Index of Small Stocks (RUT) and the S & P Midcap 400 (MID)
indexes.
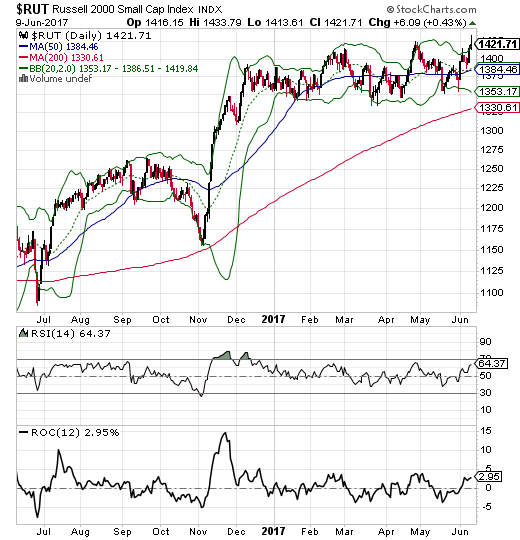
The small stock area of the market has seen support from the financial
sector as many regional bank stocks are still attractive due to their
dividends and their general tendency to remain stable during periods
of market turbulence.
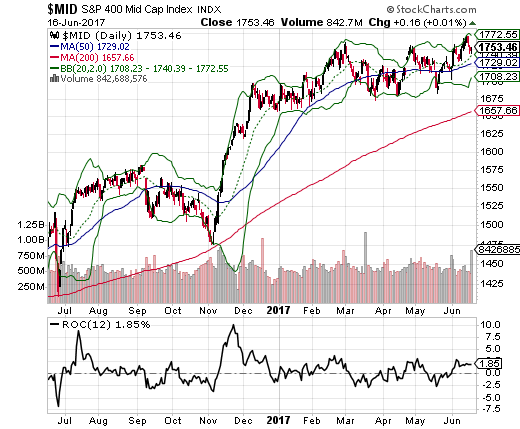
And while the action in the Russell 2000 is encouraging, I like the action
in the midcap sector a little better due to its weight toward healthcare
and IT software stocks. Indeed, while the big name tech stocks have been
hammered the smaller software stocks in MID have actually been moving sideways
and some are starting to see some signs of buying on the dip. And the same
can be said for some niche plays in healthcare.
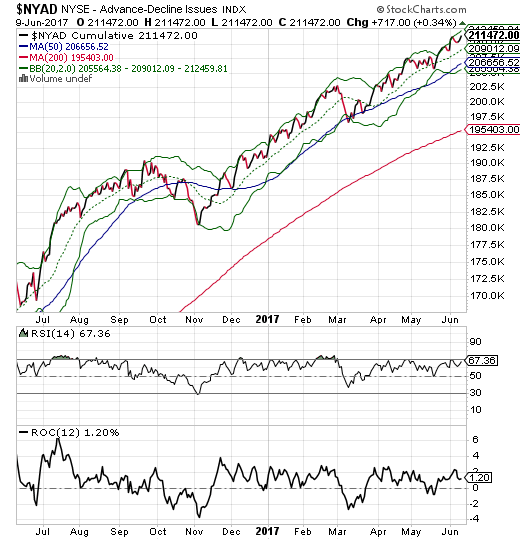
Market Breadth Remains Bullish
Regular readers know my affinity for the New York Stock Exchange
Advance-Decline line (NYAD), the line which records the difference
between advancing and declining stocks on the NYSE. When this line
rises, as it is doing at the moment, the market is in an uptrend. Moreover,
a rising AD line is a sign of positive liquidity, or money moving into
stocks. Indeed, despite the somewhat scary fundamentals in the political
arena and the selling in the large cap technology sectors, the NYAD
is just off of its recent highs, signaling a liquid market with an
uptrend, and an upward bias.
I understand. No indicator is perfect, but the NYAD is as good as it gets.
So I am encouraged by the action in the market’s breadth and its indication
of potentially higher prices ahead. Let me put it this way: in thirty years
of trading I can’t remember a bear market having started without weakness
in the advance decline.
Is This Time Different?
I don’t want to sound like I am the world’s greatest bull market cheerleader.
I’m not. I’m a trader. But I am also big fan of studying history. Thus I
want to be on record as saying I recognize we are living in unprecedented
times where the unthinkable is the norm. Specifically, for all I know, we
can enter a bear market from hell tomorrow. Yet, going on what I know today,
especially the current technical indicators in this market, this- is- not
-a -bear market.
What will change my mind? For one, a breakdown in the NYAD Advance Decline
line would be a sign of worse things to come. Secondly, if the S & P
500 breaks below its 50-day moving average convincingly, and takes the Russell
2000 and the Midcap 400 with it, I might become a rapid believer that the
bull market is in clear and present danger.
JoeDuarteInTheMoneyOptions.com is independently
operated and solely funded by subscriber fees. This web site and
the content provided is meant for educational purposes only and
is not a solicitation to buy or sell any securities or investments.
All sources of information are believed to be accurate, or as otherwise
stated. Dr. Duarte and the publishers, partners, and staff of joeduarteinthemoneyoptions.com
have no financial interest in any of the sources used. For independent
investment advice consult your financial advisor. The analysis
and conclusions reached on JoeDuarteInTheMoneyOptions.com are the
sole property of Dr. Joe Duarte.
|